Predicting early depression in WZT drawing image based on deep learning
ORIGINAL ARTICLE

Predicting early depression in WZT drawing image based on deep learning
Kyung-yeul Kim1 | Young-bo Yang 2 | Mi-ra Kim3 | Jihie Kim1 | Ji Su Park4
1 Department of Artificial Intelligence, Dongguk University, Seoul, Republic of Korea
Department of Data Science, Kookmin University, Seoul, Republic of Korea 3 Department of Liberal Arts Convergence, Kyunggi University, Seoul, Republic of Korea
4 Department of Computer Science and Engineering, Jeonju University, Jonju, Republic of Korea
Correspondence
2
Ji Su Park, Department of Computer Science and Engineering, Jeonju University, Jonju, Republic of Korea. Email: jisupark@jj.ac.kr
Funding information
MSIT (Ministry of Science and ICT), Korea, Grant/Award Number: IITP-2024-2020-0- 01789
Abstract
When stress causes negative behaviours to emerge in our daily lives, it is important to intervene quickly and appropriately to control the negative problem behaviours. Questionnaires, a common method of information gathering, have the disadvantage that it is difficult to get the exact information needed due to defensive or insincere responses from subjects. As an alternative to these drawbacks, projective testing using pictures can provide the necessary information more accurately than questionnaires because the subject responds subconsciously and the direct experience expressed through pictures can be more accurate than questionnaires. Analysing hand-drawn image data with the Wartegg Zeichen Test (WZT) is not easy. In this study, we used deep learning to analyse image data represented as pictures through WZT to predict early depression. We analyse the data of 54 people who were judged as early depression and 54 people without depression, and increase the number of people without depression to 100 and 500, and aim to study in unbalanced data. We use CNN and CNN-SVM to analyse the drawing images of WZT’s initial depression with deep learning and predict the outcome of depression. The results show that the initial depression is predicted with 92%–98% accuracy on the image data directly drawn by WZT. This is the first study to automatically analyse and predict early depression in WZT based on hand-drawn image data using deep learning models. The extraction of features from WZT images by deep learning analysis is expected to create more research opportunities through the convergence of psychotherapy and Information and Communication Technology (ICT) technology, and is expected to have high growth potential.
KEYWORDS
CNN-SoftMax, CNN-SVM, deep learning, early depression, ICT, Wartegg Zeichen Test
1 | INTRODUCTION
Stressful changes in daily life can lead to negative behaviours such as maladaptation and depression, which, if not dealt with appropriately, can lead to conditions that adversely affect people’s physical, mental, and social functioning. Depression is one such social stressor (Yang et al., 2015). Depression or depressive disorder is a condition that causes problems with a wide range of symptoms, ranging from physical, cognitive, and sensory symptoms to low motivation and depressed mood as the main symptoms, leading to a decrease in daily functioning (Lopresti, 2020). Especially in the elderly, they are exposed to increasingly difficult and complex real-life situations in their lives, and make unnecessary mistakes during the problem-solving process, while their cognitive complexity may increase (Perry Jr, 1999). If the unstable and dangerous stereotype of the
This is an open access article under the terms of the Creative Commons Attribution-NonCommercial-NoDerivs License, which permits use and distribution in any medium, provided the original work is properly cited, the use is non-commercial and no modifications or adaptations are made. © 2024 The Author(s). Expert Systems published by John Wiley & Sons Ltd.
illness-prone elderly is not used to negatively reject them, living with a diverse age group can develop their attention span and allow them to express their natural tendencies and preferences in life (Reardon MacLellan, 2011).
Depression is common in people with Alzheimer’s (Lyketsos & Olin, 2002). According to the World Health Organization and Alzheimer’s Disease International, a new case of dementia is discovered every 4 s (Falck et al., 2019). The progression of Alzheimer’s affects cognitive abilities, and depressive symptoms in older adults with cognitive impairment can occur alongside behavioural dysregulation (Kwak et al., 2023). Looking at the statistics of the elderly in Korea in 2022, the number of elderly people aged 65 and over was 9.18 million in 2022, representing 17.5% of the total population, and it is expected to reach 20.6% in 2025, entering the ultra-elderly society. In terms of the number of years it takes to reach the super-elderly society, it takes only 7 years in Korea compared to 50 years in the UK, 15 years in the US, and 10 years in Japan (Statistics Korea, Republic of Korea, 2023). This high growth in the elderly population is not just a matter of jobs, but also of health, which is directly related to the rising cost of health insurance. One of the reasons for the rise in depression is that people do not know how to deal with their anxiety and nervousness, so they lock it inside.
Questionnaires are often used as a way to explore the nature of depression, but they are self-reported, which can lead to defensive or untruthful responses, making it difficult to get the information you need. Depression and dementia have a high incidence rate among adult diseases that mainly affect the elderly, and various self-diagnosis methods for prevention of adult diseases are absolutely necessary. To eliminate these disadvantages and to prevent and complement depression, we choose a projection test that predicts depression at an early stage through pictures. Projection is a pictorial representation of direct experience to which the subject responds unconsciously. Currently, projective tests are being developed in a variety of ways depending on the subject (Mattlar et al., 1991). When an elderly person projects images of their own drawings, there are specific patterns depending on the personality of the elderly person, and universal and similar patterns appear in certain parts of the drawings (Soilevuo Grønnerød & Grønnerød, 2012). The Wartegg Zeichen Test (WZT) is selected as a projection test that can help analyse early depression in the elderly. The WZT was created by Erig Wartegg and has been used for decades with great success. The WZT involves drawing a picture in a frame of eight 4 4 cm squares in association with a given stimulus picture (Soilevuo Grønnerød & Grønnerød, 2012). The WZT has the advantage of being playful and the examiner is not conscious of being tested. It has been found that there are associations between general personality traits and various WZT-type behaviours (Crisi & Dentale, 2016; Golbeck et al., 2011). The WZT features reveal the unconscious attitudes and inherent relationships to the inner world of the person who draws, resulting in unconsciously honest and spontaneous drawings, and the drawings contain specific patterns depending on the individual’s personality (Kim et al., 2023; Roivainen & Ruuska, 2005). In an aging society, WZT can easily provide health information to the elderly.
Depression-dementia type prediction with WZT has garnered a lot of attention in the natural language processing and social science communities (Gjurkovic & Snajder, ˇ 2018). However, surveys and projections for personality type assessment are impractical because they take time to produce results and are expensive, as they involve qualified experts to assess them. Also, in terms of modelling, given the size of the data set, it makes sense to analyse it automatically using deep learning models (Cerkez et al., 2021).
In this study, we used deep learning and CNN models to predict early depression on WZT images of drawings. CNN is a popular method for extracting visual features from digital images due to its high accuracy (Bibi et al., 2021; Ning et al., 2020).
The contributions of this research can be summarized as follows.
- We propose an approach to automatically predict the early stages of depression from WZT pictures using deep learning models.
- The projection method using WZT pictures addresses the limitations of traditional self-reported questionnaire responses.
- This approach can significantly reduce the time and cost of using qualified experts.
- By integrating with the ICT industry, early prediction of depression is expected to reduce healthcare costs and improve quality of life.
In this study, the unique characteristics of individuals in hand-drawn drawings based on WZT, which is used in psychotherapy, were analysed by CNN and CNN-SVM techniques to improve the prediction probability of early symptoms of depression. Extracting the characteristics of early symptoms of depression from pictures analysed using deep learning provides new knowledge and opportunities for future research and development through convergence with the ICT industry.
This paper is structured as follows: In Section 1, we provide an overview of how WZT pictures can be used to automatically analyse early depression with deep learning, with implications for life care; Section 2 provides an overview of the semantics of WZT picture content and related work in elderly care; Section 3, we present various methods for prediction models using deep learning analysis, such as CNN-softmax and CNN-SVM; Section 4 illustrates the results of the proposed methods with figures and quantitative figures; Finally, we conclude the paper in Section 5.
2.1 | WZT
The Wartegg Zeichen Test is a picture test developed by Ehrig Wartegg in 1939 and is widely used in psychological counselling, psychotherapy, educational counselling, and offenders. The WZT is a projection test that utilizes various types of pictures on eight stimulus
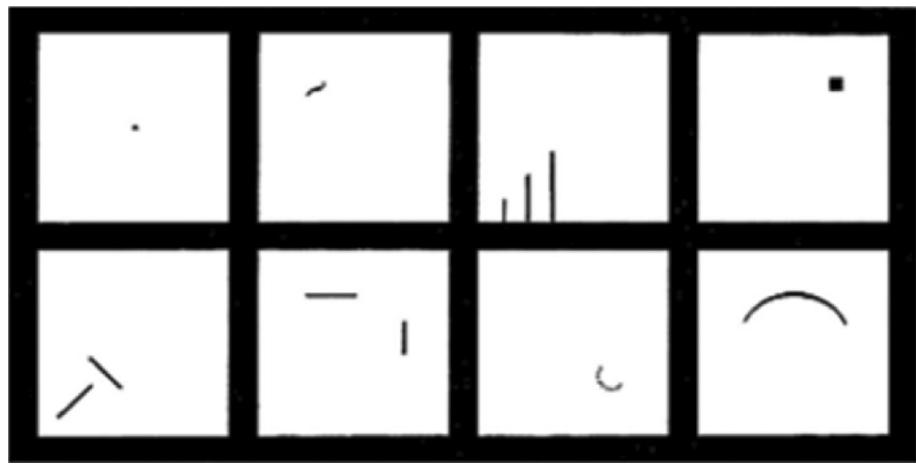
FIGURE 1 Forms of the Wartegg Zeichen Test.
pictures with a black border of 4 4 cm (Soilevuo Grønnerød & Grønnerød, 2012). Each of the eight stimulus pictures is different and has different meanings and interpretations, so you can identify the personality of the picture. The WZT has an element of play, and the examiner is not conscious of being tested. This study confirms that there is an association between general personality traits and various WZT behaviours, and shows positive results for reliability and validity (Soilevuo Grønnerød & Grønnerød, 2012). The WZT picture is expressed as Figure 1.
The meaning of the WZT picture is as follows (Avé-Lallemant, 1994).
- The first stimulus picture is the central dot. The ‘central dot’ has the meaning of the centre, the centre of self-experience. The dot is soft, organic, and indistinct, yet has a central determinacy, representing the various perceptions within oneself.
- The second stimulus picture is unique because it is a soft short curved line floating in the air with emotional lively movement. It is placed in the upper left corner of the space, which stimulates the imagination and emphasizes the characteristic of movement. It has the property of appealing to emotions.
- The third stimulus is three vertical lines that start low on the left and get higher as they move to the right, representing an ‘ascent’. This describes a strong goal orientation.
- The fourth stimulus picture is a small square, which has the meaning of feeling ‘heavy’ and pressure, and is an effective inspiration in psychological counselling. It conveys a sense of mental burden and difficulty.
- In the fifth stimulus picture, two lines are understood in the mind, and this contrasting form expresses ‘tension’, ‘hostility’ and ‘aggression’, and the extension of the lines suggests the overcoming of tension by the lines. In an introverted state of mind, the sculptural impulse is inhibited by the empty space in the upper right corner. We believe that these tensions and impulses are relevant to the appearance of depressive drawings in representations where they are suppressed.
- In the 6th stimulus picture, the separation of horizontal and numerical lines is a sign of disconnection, but at the same time, unconsciously bringing lines together or connecting them seeks ‘union’.
- In the 7th stimulus picture, the semicircle drawn with a dotted line in the lower right corner represents an emotional response of delicacy. It appeals to a sensitive and tender sensitivity. Feeling and understanding the subject of the emotion brings out the ability.
- The eighth stimulus, the arched curve, represents a sense of safety and relief. It represents many of the unique characteristics of infancy, where the underlying emotions are protected.
At the top of the WZT, the numbers start from the left. Stimulus pictures 1, 2, 7, 8 are curved and tend to represent living objects. Stimulus pictures 3, 4, 5, and 6 of the WZT are straight lines and represent mostly concrete objects. The characteristics of the WZT provide a clear understanding of the subconscious attitudes and unique relationship to the world of the individual being assessed. People draw openly, expressing themselves naturally and without defensiveness, and their drawings contain specific patterns based on their personality (Roivainen & Ruuska, 2005).
Jung (2014) categorized individuals’ attitudes and mental functions into similar, homogeneous, if not identical, traits in his psychotypology because certain morphologically similar patterns appear in the drawings. However, there is a degree of universality within each unique type.
3.2 | Early depression prediction using deep learning
Convolutional neural networks (CNNs) are a widely used model in visual processing as an architecture for finding image features in deep learning (Pradhan et al., 2023). CNNs are widely used in industries such as product image search and medical x-ray image analysis for cancer diagnosis (Heidari et al., 2020; Huang & Liao, 2022). Generally, the layers of a CNN consist of Convolution Layer, Activation Layer, Max-Pooling Layer, and Fully Connected Layer, and it shows good performance.
The activation functions used in the CNN layer are ReLU and SoftMax, and the optimizer uses Adam and sparse_categorical_crossentropy as the loss function. Epochs are performed up to 30 times and training is terminated when the validation accuracy shows no performance improvement for more than 3 epochs.
The interpretation of the output value of SoftMax can be interpreted as the probability values for N and Y. For example, if the output value is [0.2, 0.8], the probability of non-depression (N) is 20%, and the probability of depression (Y) is 80%, and the higher probability is selected as the final result. The detailed process of CNN is shown in Figure 2.
Support vector machines (SVMs) can predict nonlinear regression estimation problems, time series, and perform well for predicting binary classification problems (Wang & Mu, 2023; Zouina & Outtaj, 2017). In order to use SVM as the final classification method in the CNN algorithm, we need to change the activation function from SoftMax to linear in the last layer of CNN layers, and change the loss function from sparse_categorical_crossentropy to hinge. The interpretation of the SVM output is based on 0, and if it is negative, it is classified as non-depressed (N), and if it is positive, it is classified as depressed (Y), which is selected as the final result. The detailed process of CNN-SVM is shown in Figure 3.
4 | EVALUATION
4.1 | Evaluation criteria
A measure of classification quality was built using confusion matrices that record the number of correctly recognized and incorrectly recognized examples for each class. Table 1 shows the confusion matrix for binary classification. True Positive (TP) represents the number of positive samples that were correctly classified. True Negative (TN) is the number of correctly classified negative samples. False Negatives (FN) represents the number of misclassified negative samples. False Positive (FP) represents the number of positive samples that were misclassified.
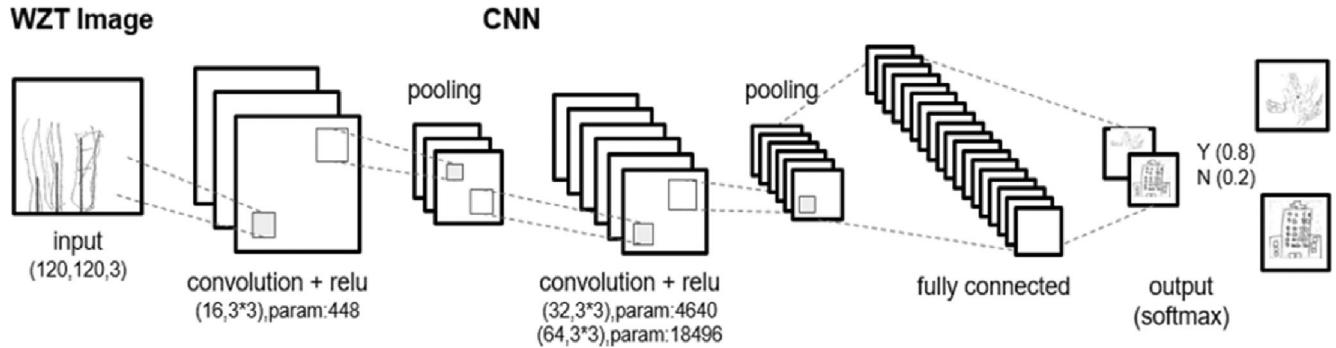

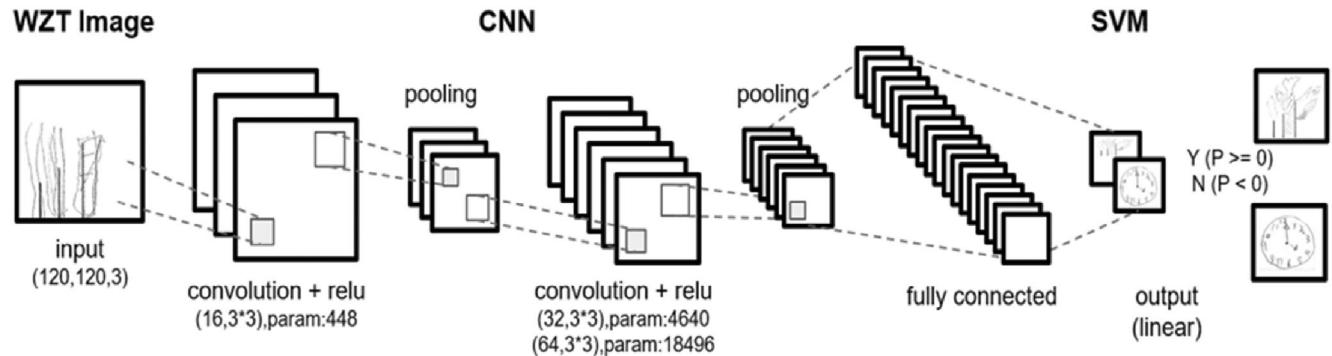
FIGURE 3 CNN-SVM model for extracting early symptoms of depression.
In this study, we use Accuracy, Precision, Recall, and F-measure to evaluate the two algorithms used in deep learning techniques. Accuracy is the percentage of measurements out of the total data that match the algorithm’s predicted value with the actual value, indicating how well it classified. Precision is the percentage of correct predictions (TP) that are actually correct (TP + FP) out of those that the algorithm predicted to be correct. Recall is the percentage of correct predictions (TP) that are actually correct (TP + FN), and the percentage of correct predictions that are actually correct that the algorithm predicted to be correct. Precision and Recall can be biased if there are many positives or negatives in the data, so F-measure uses the harmonic mean of precision and Recall to evaluate the performance of the model.
\[\mathsf{Accuracy} = \frac{\mathsf{TP} + \mathsf{TN}}{\mathsf{TP} + \mathsf{FP} + \mathsf{FN} + \mathsf{TN}},\tag{1}\]
\[\text{Precelsion} = \frac{\text{TP}}{\text{TP} + \text{FP}},\tag{2}\]
\[\text{Recall} = \frac{\text{TP}}{\text{TP} + \text{FN}},\tag{3}\]
\[\mathcal{F}-\text{measure}=\mathcal{Q}\times\frac{\text{Precision}\times\text{Recall}}{\text{Precision}+\text{Recall}}.\tag{4}\]
4.2 | Early depression picture and value
WZT shows the prediction performance by classifying the stimulus picture No. 5 out of 8 hand-drawn images by a single person as a related image with high early symptoms of depression. Figure 4 shows a WZT without early symptoms of depression, and Figure 5 shows a WZT with early symptoms of depression.
As shown in Figure 5, a typical drawing of a WZT in the early stages of depression is characterized by a lack of strength in the lines drawn and a lack of finishing touches. Drawing leaves that are large compared to the branches is an early symptom of WZT’s superficial adaptation to feelings of helplessness.
Table 2 shows the results of deep learning techniques using 27 depression data and 27 non-depression data as test data. As shown in Table 2, CNN-SoftMax and CNN-SVM predicted depression and non-depression pictures with the same 98% probability. Then, we increased the nondepression data to check whether the prediction of depression pictures was affected by the bias. The reason for introducing bias into
TABLE 1 A confusion matrix for binary classification.
| Recognized | |||
|---|---|---|---|
| Class | Positive | Negative | |
| Positive | TP | FN | |
| Negative | FP | TN |
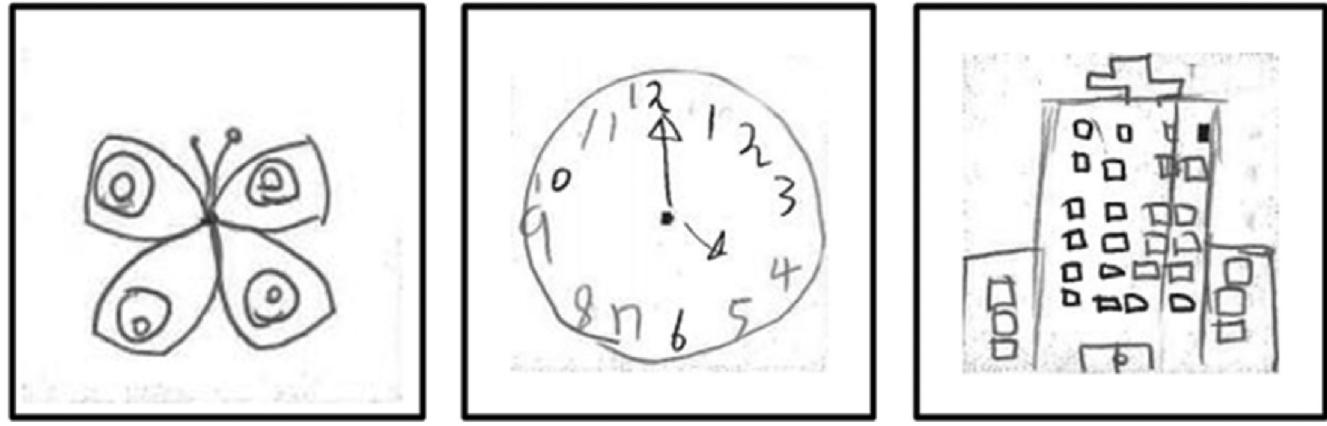

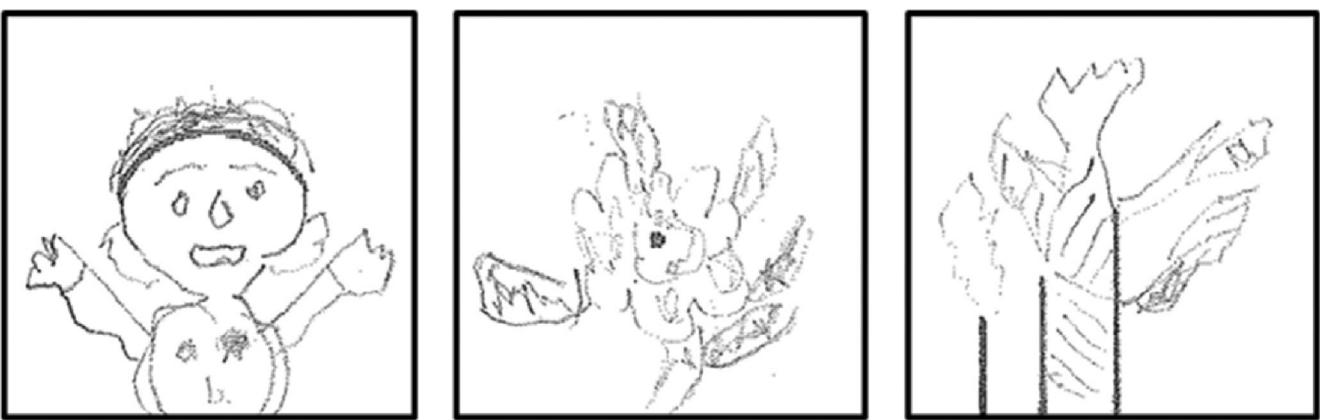
FIGURE 5 Test dataset of WZT 1, 3, 8 stimulus drawing images of people who showed early depression.
TABLE 2 Confusion matrix results (unit: people).
| Confusion matrix | |||||
|---|---|---|---|---|---|
| Method | TP | FN | FP | TN | |
| CNN-SoftMax | 12 | 1 | 0 | 13 | |
| CNN-SVM | 12 | 1 | 0 | 13 | |
| CNN-SoftMax—100 | 12 | 1 | 0 | 20 | |
| CNN-SVM—100 | 11 | 2 | 0 | 20 | |
| CNN-SoftMax—500 | 13 | 0 | 1 | 49 | |
| CNN-SVM—500 | 8 | 5 | 0 | 50 |
TABLE 3 Algorithm evaluation criterion value (unit: %).
| Evaluation | |||||
|---|---|---|---|---|---|
| Method | Accuracy | Precision | Recall | F1 | |
| CNN-SoftMax | 0.96 | 1.0 | 0.92 | 0.96 | |
| CNN-SVM | 0.96 | 1.0 | 0.92 | 0.96 | |
| CNN-SoftMax—100 | 0.97 | 1.0 | 0.92 | 0.96 | |
| CNN-SVM—100 | 0.94 | 1.0 | 0.85 | 0.92 | |
| CNN-SoftMax—500 | 0.98 | 0.93 | 1.0 | 0.96 | |
| CNN-SVM—500 | 0.92 | 1.0 | 0.62 | 0.76 |
the prediction model is that if the model has a high probability of predicting depression without bias, then the model has high predictive confidence. When the number of non-depression data was increased to 100, the CNN-SoftMax method failed to make one prediction and the CNN-SVM method failed to make two predictions. Then, when the number of non-depression data was increased to 500, the CNN-SoftMax method failed to make one prediction and the CNN-SVM method failed to make five predictions.
As a result, Table 3 shows that the accuracy of predicting depression in WZT images is about 92%–98.4%, which shows the accuracy of predicting depression. The CNN-SVM technique has a linear activation function in the last layer, so it may show a decrease in prediction performance when nonlinear data increases, while the CNN-SoftMax technique has a ReLU activation function, so it is less affected by the increase in nonlinear data.
5 | CONCLUSION
In recent years, deep learning technology has been improving day by day and is beginning to show results that are sufficient to make reliable personality predictions. In terms of ICT utilization, this study introduces a study that uses WZT to find unique features of depression and dementia in
images drawn by the elderly to predict the disease. The characteristics can be represented not only by text that can be used for questioning the elderly, but also by complex patterns of images that can be projected onto the images drawn by WZT. In addition, the social engagement of the elderly online, which is based on ICT technology, can be expected to provide positive social interaction to counteract loneliness and subsequent depression. Knowledge-based services from various industries should be expanded in the lives of the elderly to positively improve their quality of life. This means that in an aging society, the need to provide information services utilizing various geriatric policies and ICTs is increasing, and positive social interaction for the elderly is expected. One of the various measures to prevent depression and dementia among the diseases of the elderly in a personalized manner is to utilize a prediction system with deep learning using WZT.
In the WZT illustration, early prediction of depression is a challenging task, even for deep learning analytics. Nevertheless, it is important to recognize that deep learning can make early predictions of depression, and since it can predict depression, more data is needed for better predictions.
No one can explain all the complexities of human beings, no matter how justified depression is. However, all the characteristics of depression are worth understanding. Predicting the characteristics of early depression from WZT image data by analysing them with deep learning is a very cautious task. People who are exposed to depression and have difficulty socializing should be provided with educational methods to cope with depression. In addition, efforts should be made to effectively plan and implement learning and teaching methods that can suppress depression, and deep learning can help predict the early stages of depression using WZT images.
In this study, depression was predicted after automatic analysis using deep learning using pictures represented by WZT stimulus tests. The initial average prediction value of CNN-SoftMax was 96.1%. When the number of non-depression data was increased to 500, the average prediction value increased to 98.4%, and the CNN-SVM decreased to 92.1%. This shows that the CNN method can automatically predict depression with a high accuracy value.
The physical, mental, and social changes that depression causes are stressful in and of themselves. As such, unstable depression, which is vulnerable to stress, can lead to a variety of maladaptive problems. Importantly, more data is needed to make more accurate predictions. In order to predict depression in the elderly, we need to collect more information about the disease and conduct more research, and we need to study the positive aspects of social interaction through the convergence of ICT and AI. In many areas of deep learning, models that apply automatically will be studied. As a follow-up to this paper, we are currently preparing to acquire more data and develop an improved model to improve the research and prediction rate of dementia. This research is expected to create many opportunities for the utilization of deep learning for geriatric diseases in the future.
ACKNOWLEDGEMENTS
This research was supported by the MSIT (Ministry of Science and ICT), Korea, under the ITRC (Information Technology Research Center) support program (IITP-2024-2020-0-01789) supervised by the IITP (Institute for Information & Communications Technology Planning & Evaluation).
DATA AVAILABILITY STATEMENT
The data that support the findings of this study are available on request from the corresponding author. The data are not publicly available due to privacy or ethical restrictions.
ORCID
Ji Su Park https://orcid.org/0000-0001-9003-1131
REFERENCES
Avé-Lallemant, U. (1994). DerWartegg-Zeichentestin in der Lebensberatung (2nd ed.).
- Bibi, S., Abbasi, A., Haq, I. U., Baik, S. W., & Ullah, A. (2021). Digital image forgery detection using deep autoencoder and CNN features. Human-centric Computing and Information Sciences, 11, 1–17.
- Cerkez, N., Vrdoljak, B., & Skansi, S. (2021). A method for MBTI classification based on impact of class components. IEEE Access, 9, 146550–146567.
- Crisi, A., & Dentale, F. (2016). The wartegg drawing completion test. Inter-rater agreement and criterion validity of three new scoring categories. International Journal of Psychology and Psychological Therapy, 16(1), 83–90.
- De Pue, S., Gillebert, C., Dierckx, E., Vanderhasselt, M. A., De Raedt, R., & Van den Bussche, E. (2021). The impact of the COVID-19 pandemic on wellbeing and cognitive functioning of older adults. Scientific Reports, 11(1), 4636.
- Falck, R. S., Davis, J. C., Best, J. R., Crockett, R. A., & Liu-Ambrose, T. (2019). Impact of exercise training on physical and cognitive function among older adults: A systematic review and meta-analysis. Neurobiology of Aging, 79, 119–130.
- Gjurkovic, M., & Snajder, J. (2018). Reddit: A gold mine for personality prediction. In ˇ Proceedings of the second workshop on computational modeling of people’s opinions, personality, and emotions in social media (pp. 87–97).
- Golbeck, J., Robles, C., Edmondson, M., & Turner, K. (2011). Predicting personality from twitter. In 2011 IEEE third international conference on privacy, security, risk and trust and 2011 IEEE third international conference on social computing (pp. 149–156). IEEE.
- Heidari, M., Mirniaharikandehei, S., Khuzani, A. Z., Danala, G., Qiu, Y., & Zheng, B. (2020). Improving the performance of CNN to predict the likelihood of COVID-19 using chest X-ray images with preprocessing algorithms. International Journal of Medical Informatics, 144, 104284.
- Hofer, M., & Hargittai, E. (2024). Online social engagement, depression, and anxiety among older adults. New Media & Society, 26(1), 113–130.
- Huang, M. L., & Liao, Y. C. (2022). A lightweight CNN-based network on COVID-19 detection using X-ray and CT images. Computers in Biology and Medicine, 146, 105604.
Jung, C. G. (2014). Collected works of CG Jung. In Volume 14: Mysterium coniunctionis (Vol. 37). Princeton University Press.
Kim, K. Y., Yang, Y. B., Kim, M. R., Park, J. S., & Kim, J. (2023). MBTI personality type prediction model using WZT analysis based on the CNN ensemble and GAN. Human-Centric Computing and Information Sciences, 13.
Kwak, S., Kim, H., Oh, D. J., Jeon, Y. J., Oh, D. Y., Park, S. M., & Lee, J. Y. (2023). Lower cognitive function attenuates the convergence between self-ratings and observer ratings of depressive symptoms in late-life cognitive impairment. Brain and Behavior, 13(3), e2898.
Lopresti, A. L. (2020). The effects of psychological and environmental stress on micronutrient concentrations in the body: A review of the evidence. Advances in Nutrition, 11(1), 103–112.
Lyketsos, C. G., & Olin, J. (2002). Depression in Alzheimer’s disease: Overview and treatment. Biological Psychiatry, 52(3), 243–252.
Mattlar, C. E., Lindholm, T., Haasiosalo, A., Vesala, P., Rissanen, S., Santasalo, H., Veijola, J., Lehtinen, V., & Puukka, P. (1991). Interrater agreement when assessing alexithymia using the drawing completion test (Wartegg Zeichentest). Psychotherapy and Psychosomatics, 56(1–2), 98–101.
Murray, C. J., & Lopez, A. D. (1997). Alternative projections of mortality and disability by cause 1990–2020: Global burden of disease study. The Lancet, 349(9064), 1498–1504.
Ning, X., Gong, K., Li, W., Zhang, L., Bai, X., & Tian, S. (2020). Feature refinement and filter network for person re-identification. IEEE Transactions on Circuits and Systems for Video Technology, 31(9), 3391–3402.
Park, S. H., Lee, K. H., Park, J. S., & Shin, Y. S. (2022). Deep learning-based defect detection for sustainable smart manufacturing. Sustainability, 14(5), 2697.
Perry, W. G., Jr. (1999). Forms of intellectual and ethical development in the college years: A scheme. Jossey-Bass higher and adult education series. Jossey-Bass Publishers.
Pradhan, A. K., Das, K., Mishra, D., & Chithaluru, P. (2023). Optimizing CNN-LSTM hybrid classifier using HCA for biomedical image classification. Expert Systems, 40(5), e13235.
Reardon MacLellan, C. (2011). Differences in Myers-Briggs personality types among high school band, orchestra, and choir members. Journal of Research in Music Education, 59(1), 85–100.
Roivainen, E., & Ruuska, P. (2005). The use of projective drawings to assess alexithymia. European Journal of Psychological Assessment, 21(3), 199–201.
- Schlomann, A., Seifert, A., Zank, S., Woopen, C., & Rietz, C. (2020). Use of information and communication technology (ICT) devices among the oldest-old: Loneliness, anomie, and autonomy. Innovation in Aging, 4(2), igz050.
- Siette, J., Georgiou, A., Brayne, C., & Westbrook, J. I. (2020). Social networks and cognitive function in older adults receiving home-and community-based aged care. Archives of Gerontology and Geriatrics, 89, 104083.
- Soilevuo Grønnerød, J., & Grønnerød, C. (2012). The Wartegg Zeichen test: A literature overview and a meta-analysis of reliability and validity. Psychological Assessment, 24(2), 476–489.
- Song, W., Zhang, L., Tian, Y., Fong, S., Liu, J., & Gozho, A. (2020). CNN-based 3D object classification using Hough space of LiDAR point clouds. Human-Centric Computing and Information Sciences, 10, 1–14.
- Statistics Korea, Republic of Korea. (2023). Senior citizen statistics in 2023.
- Wang, H., Naghavi, M., Allen, C., Barber, R., Bhutta, Z., & Carter, A. (2016). A systematic analysis for the global burden of disease study 2015. Lancet, 388 (10053), 1459–1544.
- Wang, Q., & Mu, Z. (2023). Feature selection and SVM parameter synchronous optimization based on a hybrid intelligent optimization algorithm. Human-Centric Computing and Information Sciences, 13.
Welch, C. A., Czerwinski, D., Ghimire, B., & Bertsimas, D. (2009). Depression and costs of health care. Psychosomatics, 50(4), 392–401.
World Health Organization. (2023). Depressive disorder (depression). World Health Organization.
- Yang, L., Zhao, Y., Wang, Y., Liu, L., Zhang, X., Li, B., & Cui, R. (2015). The effects of psychological stress on depression. Current Neuropharmacology, 13(4), 494–504.
- Yu, H., Zhang, J., & Feng, H. (2024). Secure CPS content-based image retrieval using tripartite delayed homomorphic secret sharing & CNN. Human-Centric Computing and Information Sciences, 14.
- Zouina, M., & Outtaj, B. (2017). A novel lightweight URL phishing detection system using SVM and similarity index. Human-Centric Computing and Information Sciences, 7(1), 1–13.